On 25 May, EASA published document number MOC SC-VTOL Issue 1, “Proposed Means of Compliance with the Special Condition VTOL” on their website. Comments are due by July 24, and I hope our readers will take time to look it over and, if possible, provide input. The document is 85 pages long, so I know it’s a big ask. At a minimum, reading it will provide you with a grasp of some terms that may begin to make their way into the vernacular, because it begins to provide a shared taxonomy for this evolution of aerospace technology. Several things caught my eye—probably because the news article I read published this particular image—and I wanted to discuss them here.
Lift/thrust unit is the new term that EASA has given to the unique configuration of components that provide thrust and/or lift and/or control. In fact, this MOC completely replaces the terms “engine,” “turbine,” “powerplant,” and “rotor”—whenever referencing the existing rules and regulations—with the new term, Lift/thrust unit. This document, the Proposed MOC complements a previous document published by EASA, the Special Condition SC-VTOL-01, but I think you should read the MOC first.
Why are we here?
I can’t answer that question in its entirety, but I will explain the purpose of this particular column. The timing of this EASA document was serendipitous. Its publication coincided, loosely with several other things happening in the aerospace community and industry. Therefore, this column has the following three main goals.
1. Alert readers to its publication and recommend review.
2. Inform readers of relevant news at the intersection of flight test safety and VTOL.
3. Investing in the technical development of readers: Specifically, talking about probability and how we update our beliefs about probability when accidents happen. So let’s see if we can get this conversation off the ground.
Two Categories of VTOL
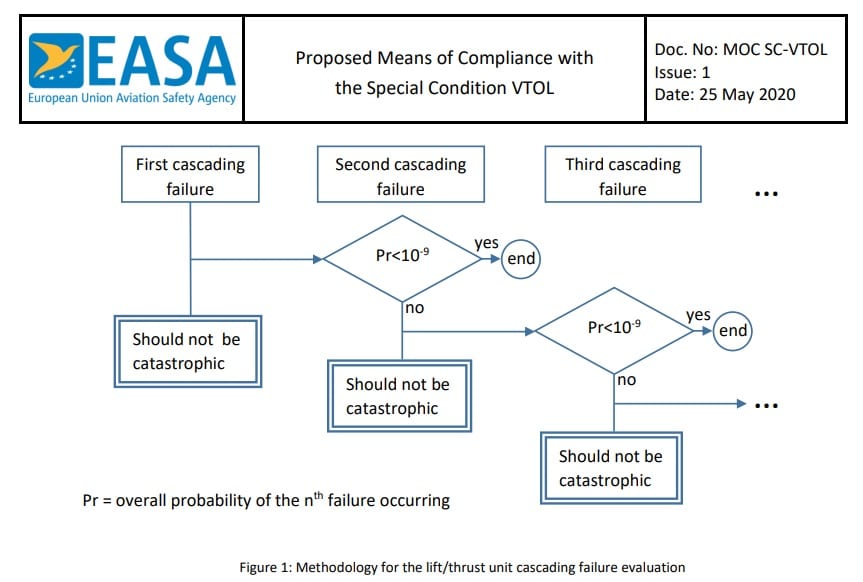
EASA has defined two distinct categories for VTOL certification: Category Basic and Category Enhanced. (See Special Condition [SC-VTOL-01] for a precise definition.) Loosely speaking, there is strong correlation between Part 23 and Category Basic, with a similar analogy between Part 25 and Category Enhanced. Certainly, we can conclude that they intend a higher standard of design safety for commercial operations. I mention this because the flow chart above applies to failure of a lift/thrust unit for Category Enhanced VTOLs.
The Flow Chart
The flow chart in Figure 1 above states: A failure of any Lift/thrust unit should not be catastrophic. That seems fair. It’s the second column, “Second Cascading Failure,” that probably means something different to the average reader, something we should pause to truly consider. EASA explains their reasoning for the flow chart this way: “Due to the distributed propulsion, the failure of a lift/thrust unit may, for some architectures, potentially cause other lift/thrust failures in a chain reaction” (page 25). According to this chart, if the first failure is the beginning of a cascade, then the second failure should have a probability of less than 10-9 per flight hour (or not be catastrophic). It’s important to really consider what this means.
What is Pr < 10-9 ?
Most of us have a hard time comprehending, really understanding at a visceral level, what this means. Let me try to describe it in a more meaningful way: There are 60 seconds in a minute. Likewise, there are 60 minutes in an hour, or 3600 seconds. If we continue multiplying in this way, we find that there are 3 x 10⁹ seconds in one hundred years. When I first sat down to perform this estimation, my intuition suggested that I would get to the desired order of magnitude in a single year. I was waaayy off. This demonstrates, I think, how our intuition is ill-equipped to consider problems of this magnitude (and their inverse). The probability in question, from the flow chart, means that the chance of this failure is 1 in 109 flight hours. That’s more than 100,000 years worth of flight hours. Our first goal is to understand how enormous this number is, or how very small the probability is, and I think this illustration helps.
The reader may object immediately to the illustration above, with the caveat that the probability should hold for the whole fleet. This is true, but it does not change the sheer magnitude of the number, which was the first goal of the illustration. As Pete Donath pointed out, “Yes, even if they make 8,000 VTOLs, that’s still a lotta’ flying hours per frame, and these don’t do the 14 hour flights like the long haul jets. My sarcastic FTE remark is: ‘When a design engineer tells me it’s ten to the minus nine, I’m only going to see it happen three times in the first thousand hours of test.’ But the good news behind that is we (Flight Test) help find deficiencies, and the design gets better.” I laughed out loud when I read his sarcastic comment, but I think he hit the nail on the head—there’s some truth in that statement that we may not have time to discuss. (The ambitious reader should consider reading up on exponential and Weibull distributions.)
What is a Catastrophic Failure?
The second way to exit the flow chart is to assess that the failure is not catastrophic. I don’t want to spend a lot of time discussing definitions of these terms, but my question is this: How well do we imagine the outcomes of these failure modes? For example, were you aware that Kitty Hawk had a software “timing error” with their Heaviside VTOL? That sounds innocent enough. The operator had failed to disable a battery charging script at the ground control station prior to flight. Neither one of those things sounds catastrophic, but the aircraft did, in fact, crash. The NTSB determined that software was the cause.
On the subject of software, one editor said this: “One central challenge is that software is embedded in many elements of the complex system making up the control system of any modern air vehicle. But, here’s the big hitch: Software doesn’t fail. It always does exactly what the compiled code tells it to do.” I will happily admit that this is not my area of expertise, and furthermore, I may not know the precise way to parse my language on this topic. Nevertheless, I think we agree that software, and its bugs, may contribute to the failures described in the flow chart.
I did some research, in an attempt to answer some questions about software reliability, but I came up mostly empty. I did find some academic/instructional material on the topic but nothing practical. The closest I came to something we might recognize is the NASA Software Assurance program and supporting documentation. They have very specific and thorough requirements for a Software Assurance program, especially in the case of manned spacecraft. They do not publish probabilities or reliability requirements—at least none that I could find. Boeing’s recent Starliner flight test should remind us that software bugs are a very real possibility. One reporter suggested that they narrowly missed catastrophic failure. In any case, to complete my investigation into software failure rates, I appeal to the readers—do you know of any experts or authoritative references on the topic? One reader suggested DO-178C may have the answers, but at press time, I hadn’t found a way to access the document.
Minimum Acceptable Handling Qualities Rating (MAHQR)
The second item that really caught my attention, was the computation of probabilities related to MAHQR. The document’s Table 2 illustrates the discussion about the Flight Conditions required for Handling Qualities assessments. They define a method for computing the probability of a given flight condition as XFE × XFC × XAD. This is mostly jargon, but the important point is this: Multiply the probability of a Flight Envelope (FE) times the probability of a Failure Condition (FC) times the probability of an Atmospheric Disturbance (AD). For those who have forgotten, they are saying P(A and B) = P(A) × P(B), but this is only true when the events are independent. It is unfortunate that “independence” is such a nuanced topic, but let me try to illustrate.
Consider, for example, the flight of a business jet into severe turbulence (which is what EASA means by Atmospheric Disturbance [AD]). Do we believe that an aircraft in severe turbulence is more likely to suffer damage or other failure modes? I recommend the article above, because it will inform your intuition and help you answer the question. The simple fact that an Atmospheric Disturbance (AD) like severe turbulence may increase the chance of a Failure Condition means they are not independent. I believe that EASA knows this, but the ensuing discussion about how to “adjust” seems too vague. I’m not certain that a manger who has to approve the risk could understand it. It is, however, a technical nuance that we need to remember with sufficient familiarity, enough to make us ask someone to explain it, when necessary. I would also point the reader to the pilot’s description of Handling Qualities in the report of the Heaviside crash as relevant to this portion of the description as well. That crash and the wake turbulence event above should also inform our ideas about the frequency (or probability) of these kinds of events, and they might even give us a way to update our beliefs about probability assessments.
Updating our Beliefs
As we close, I want to plant the seed of discussion with one more question. How do we update our beliefs about probability when we gather new data, learn something new, or witness an accident? Knowing how to properly assess the information in that event is the subject of an entirely different column, but it is an equally important one.
We haven’t covered much of the EASA Proposal, but I believe that what we have covered should make us all pause before we gloss over exponents and quantitative criteria for safe system design and lead us to the following conclusions.
Conclusions and Recommendations
Every good flight test document has a section with conclusions and sometimes a recommendation or two, so I provide mine here. I recommend that you read the document in order to:
1. Learn about an approach to VTOL certification.
2. Review the proposal and provide input by July 24.
3. Familiarize yourself with the growing vocabulary.
4. Grow as a flight test safety professional.
5. Brush the dust off your probability knowledge and skills.
I hope you will glance over the document and reflect thoughtfully on your intuitions about chance and statistics. I believe the short discussion here will dovetail nicely with Animal Javorsek’s paper (next time) which references Brownian motion and its analogy to accident investigation and safety management. I also hope this column helps you sharpen the saw of our quantitative reasoning, a task we must return to regularly and humbly as we gain in qualitative experience in our careers.
This article first appeared in Flight Test Safety Fact, 20-06.