by Andrew Zachar and Mark Jones Jr.
This article first appeared in the April 2015 Flight Test News.
Flutter is a dynamic instability of an elastic structure in a fluid flow, observed as positive feedback between the structure’s deflection and the force exerted by the flow, and it is infamous for its ability to kill and destroy. Execution of these dangerous tests forces the test team to summon from within both technical expertise and courageous test discipline. We believe that FTN’s technical columns can be a laboratory, a place where we introduce ideas that may not be an extract from a textbook or test handbook, but the ideas will certainly benefit from the rigorous discussion that we expect and hope will blossom following their explanation here. Therefore, it is the gray area at the intersection of flutter technical expertise and discipline in high-risk testing that we discuss here. Thus with the mild assumption that the reader is familiar enough, we jump into the discussion of test execution.
Regulatory requirements say that we must demonstrate through flight test that the airplane is free of flutter below speeds of 1.2VD, the design dive speed. So, let’s jump in the airplane to do some high speed dives and see if the airplane falls apart, right? Of course not. First, the flutter experts go into their cubicles and examine the structural design and flight regime for which certification is expected, usually design dive speed, VD. When looking at a structure—say a Boeing 737 wing, for example, cantilevered from the fuselage with an engine hanging underneath—the flutter experts first identify all the ways the wing can deflect. There are many such modes, but let’s look at two in particular: Bending (wingtip goes up and down) and Torsion (wingtip twists). When we investigate these modes, we can see that a disturbance causes a certain wave-like response in the structure. These disturbances may be due to turbulence or control input or some other excitation. We also see that with disturbances at different frequencies, particular modes may respond more strongly due to the natural frequency of the structure. Additionally the frequency and damping of the response change with airspeed, so the experts draw up at least two charts for every mode. The first is a velocity-frequency chart, and the other is a velocity-damping ratio chart.
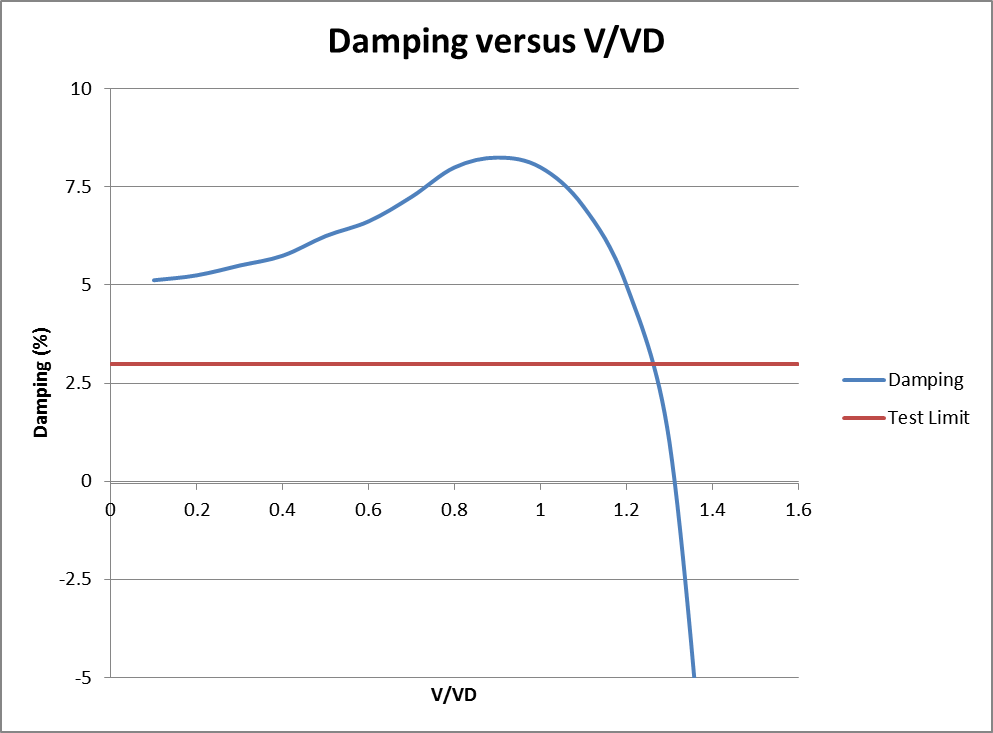
In this example, the plot shows a mode that initially demonstrates a damping increase with speed, but then the curve turns the corner and eventually crosses the x-axis, i.e., it diverges. Also note the x-axis of the plot is V/VD, showing the limit of interest, 1.2VD. It shows all of the speeds below our test limit have positive damping predicted. Are we certified yet? Not quite. Armed with these predictions, Flight Test will verify the results of the analysis using the classic build-up approach as the test methodology. This means slowly stepping out to the edge of the envelope in preplanned speed increments, each time exciting the structure, measuring net damping, and plotting it alongside the predictions to see if the analysis was correct. If the results match predictions, and the trends don’t predict flutter or unacceptable damping ratios at the next speed, the test team proceeds to the next step. Let’s examine each step in more detail.
Slowly stepping out to the edge and expanding the envelope is the most critical portion of the testing. Usually, upon receiving clearance from the flutter and handling qualities teams, the crew accelerates to the test speed and performs a small handling qualities evaluation, asking the question “does the airplane still handle like a conventional airplane?” Once confirmed, the crew is cleared to perform a series of excitations. The first is usually control raps in each axis. The TM room team plots the frequency and aircraft response from the accelerometer data and calculates damping ratio to verify expected results. Following the raps, flutter vanes or similar methods introduce a series of preprogrammed excitations, to allow a more precise frequency/magnitude input and target the most critical modes.
Engineering uses flight test data to determine net damping using accelerometers. Damping is the sum of the structure’s natural positive damping and aerodynamic damping. The structure itself resists motion (structural damping) and fluid flow provides either positive aerodynamic damping or contributes to the divergent motion (negative aerodynamic damping). For the purposes of this paper, let’s assume structural damping is always 3%. If the response shows calculated damping of 7% after a particular excitation, we will assume that 3% was structural and 4% was aerodynamic damping. Actual structural divergence (flutter) would occur when net damping falls below 0%. Consequently, a common flight test technique is to stop at 3% net damping, because below this the structure is compensating for negative aero damping. (In other words, if net damping is 2%, then structural damping of 3% must sum with an aero damping component of -1%. If, during testing, aero damping contribution goes to 0, it is usually enough to either confirm results or stop the test to investigate the cause of any unusual results.
Ideally, all the test data lines up exactly with the predictions, and the test team proceeds through the build-up as planned. But many times unpredicted responses or other variations introduce scatter and result in data that does not align with predictions. How does the team decide to proceed?
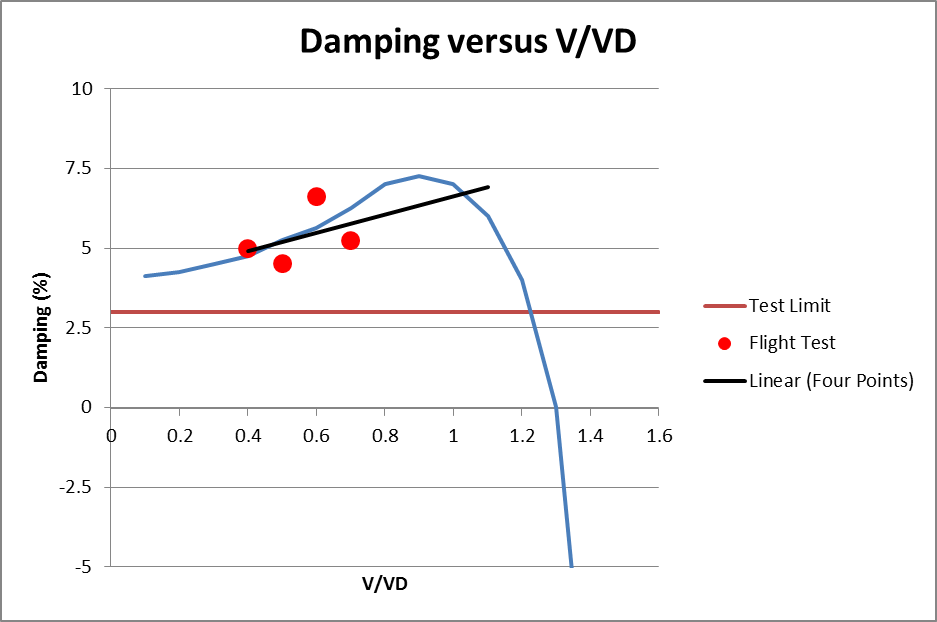
As seen here in example test data, one observes that we have collected four points. Based on the predictions, where do you think the next point will be? Perhaps drawing a trend-line through the first four points will help us decide. This looks like a reasonable fit to the actual data, and it might suggest that actual damping is less than predicted. From this we probably conclude it is safe to proceed with caution.
But let’s pause and consider for a moment what might happen if we are wrong? Suppose, for example, our step size between test points is too large. This might occur inadvertently—the test team may attempt the next test point and find themselves slightly faster than planned for any number of reasons. If we do take a “bigger step” what are the possible consequences?
On the one hand, we expect linearity, at least locally, in that portion of the predicted curve that we believe we are in. However, if for some unknown reason, the actual damping does not match predictions and the curve of actual damping is shifted left of the prediction, then we may not have enough resolution to detect the non-linear trend at the point of inflection of the curve. If this is the case, then the trend line that appears below may actually be more accurate, matching the downward portion of the curve if it were shifted to the left, with an additional point plotted representing a bigger step. There is uncertainty about which prediction or trend-line to believe. How do we proceed? Are we facing the steep cliff of decreasing damping sooner than expected?

To illuminate the issue at hand even more, let us examine some ways that test data may not match predictions. The first is the presence of noise in the computation of damping. As stated previously, the aircraft response data are from accelerometers, placed near a wingtip, for example. From these comes a plot of the surface position/displacement, a sinusoidal wave of decreasing amplitude. There are many curve fitting tools and other discrete methods for estimating the damping from this plot. (The SFTE reference handbook provides detailed explanation of the calculation of damping in section 8.3.2.) Experience tells us that even small changes in curve fits may result in “wildly” different estimates of damping. We say wildly a bit loosely, but it can certainly change whether a flight test point appears above or below the prediction curve. Differences in TM personnel or slight differences in analyst judgment may both introduce these variations. For example, if the speed bleeds off slowly during a test point, the damping results may show an anomaly. Anther example of variation would include air quality.
In the face of such uncertainty, the test team may mitigate risk in several ways. The first mitigation ought to take place during test plan writing and mission planning: Engineering should provide a sensitivity analysis or predictions on the magnitude of potential variance. They should ready themselves to answer the first question a test team ought to ask, “What kind of variance in test results might we observe?” The test team should translate the answer to this question and its answer into results that the flight test team can observe during testing. Blind reliance on engineering judgment ought not to be part of the strategy.
This last comment highlights an important aspect of trust and communication between various elements of the test team. On the one hand, engineers need the freedom to wrestle with uncertainty in their analysis—they need permission to communicate results with a shared vocabulary of variance. This may manifest itself as “more than one answer,” i.e., multiple computations of damping using separate methods or performing the same method with two slightly different curve fits. But, how does this build trust? Because it’s realistic—it is highly unlikely that the engineer will settle on the “right answer” the first time, for all the reasons we’ve been discussing. Multiple answers begin to paint a quantitative picture of the uncertainty and equip the team with a “decision space” in which to make decisions about both technical and safety aspects of the test. Equipped with these results, one essential strategy for mitigating uncertainty is to take a smaller step size. Another is to repeat test points, and yet a third is to evaluate variance of initial conditions. In other words, are the inputs roughly the same magnitude? Though it is uncertain what the best way to incorporate all of these techniques is, a better way is to script out which technique the team will use ahead of time.
About the Author
Andrew Zachar is a Flight Test Engineer for Honda Aircraft Company (previously of Cessna Aircraft Company) who realizes that after ten years of experience (yes, he’s counting his internship), he is just scratching the surface of knowledge, experience, and lessons learned. He looks forward to many more years of learning lessons and learning from others.
Editor’s Note: This discussion of test discipline, flutter flight test, and the build-up approach grew out of a conversation that started across two desktops. I happened to be in that part of our office and find out that the lead FTE had been explaining some things to a junior member of his team, a rookie whose first post-college job was on our team. Andrew had been part of the test planning and execution process since the beginning and had seen it done at more than one company—it was an informal mentoring session. I mentioned offhand that I wanted to hear that conversation, so he recounted it to me and even typed up a few pages of notes. After a few more conversations, I encouraged him to submit his notes for publication in this column and offered to edit and write it with him.
I mention this for several important reasons. First, I believe that we need to highlight the kind of one-on-one investment that our members are making in the next generation of flight test professionals. I direct this comment first to those of us who are leaders in our society, those of us who, by title or by experience, have the privilege of influence. Let’s catch them doing the right thing instead of always waiting until something goes wrong to give them feedback. Second, I want to encourage members at every level to share their lessons learned. This column is just the place to share those anecdotes and get feedback on early stage ideas as you consider preparing a technical paper for the coming symposium. Additionally, many notable leaders have suggested that wisdom is not just learning from one’s own mistakes and experience but learning from others and not repeating it. This advice echoes what Jesús said so well above, “No matter how humble you think your work is, there will be people in other places that could benefit from your flight test experience and knowledge.”
This article first appeared in the April 2015 Flight Test News.